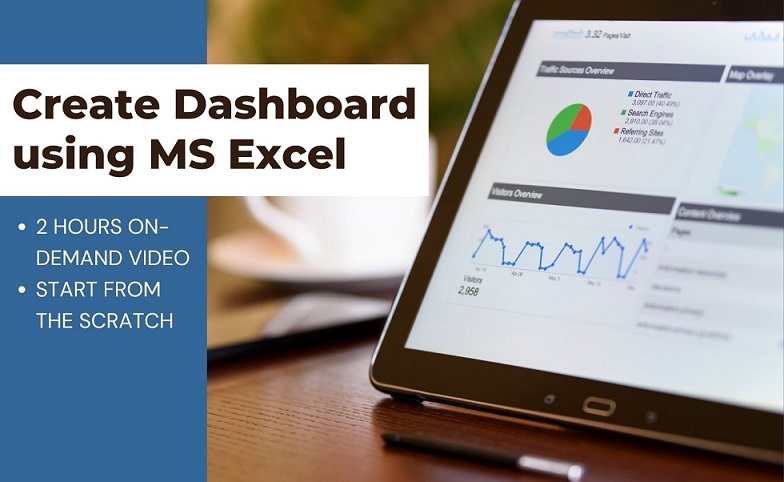
Create Interactive Dashboard using MS Excel in 2 hours

Data visualization is one of the key elements of report/MIS presentation nowadays, which can be done through a modern tool like interactive dynamic dashboards. The easiest way to build your interactive dynamic dashboard is to use MS Excel software which is widely used worldwide to keep day-to-day data on marks. Majority of the people find […]
Python for Data Analytics

Python is a language that is very easy to learn even if you are a beginner and don’t have any programming background. It is well-worse with powerful libraries for machine learning, deep learning and AI which make it mode powerful. All our videos are recordings of our live training. We have intentionally kept discussions with […]
